Water resources are getting more and more important with each passing day in case of survival of humanity. For this reason, assessing water resources’ quality and also monitoring them have attracted lots of attention in the recent years. Remote sensing has been growing widely in the last decade and its resources are very usable when it comes to water resources management.
|
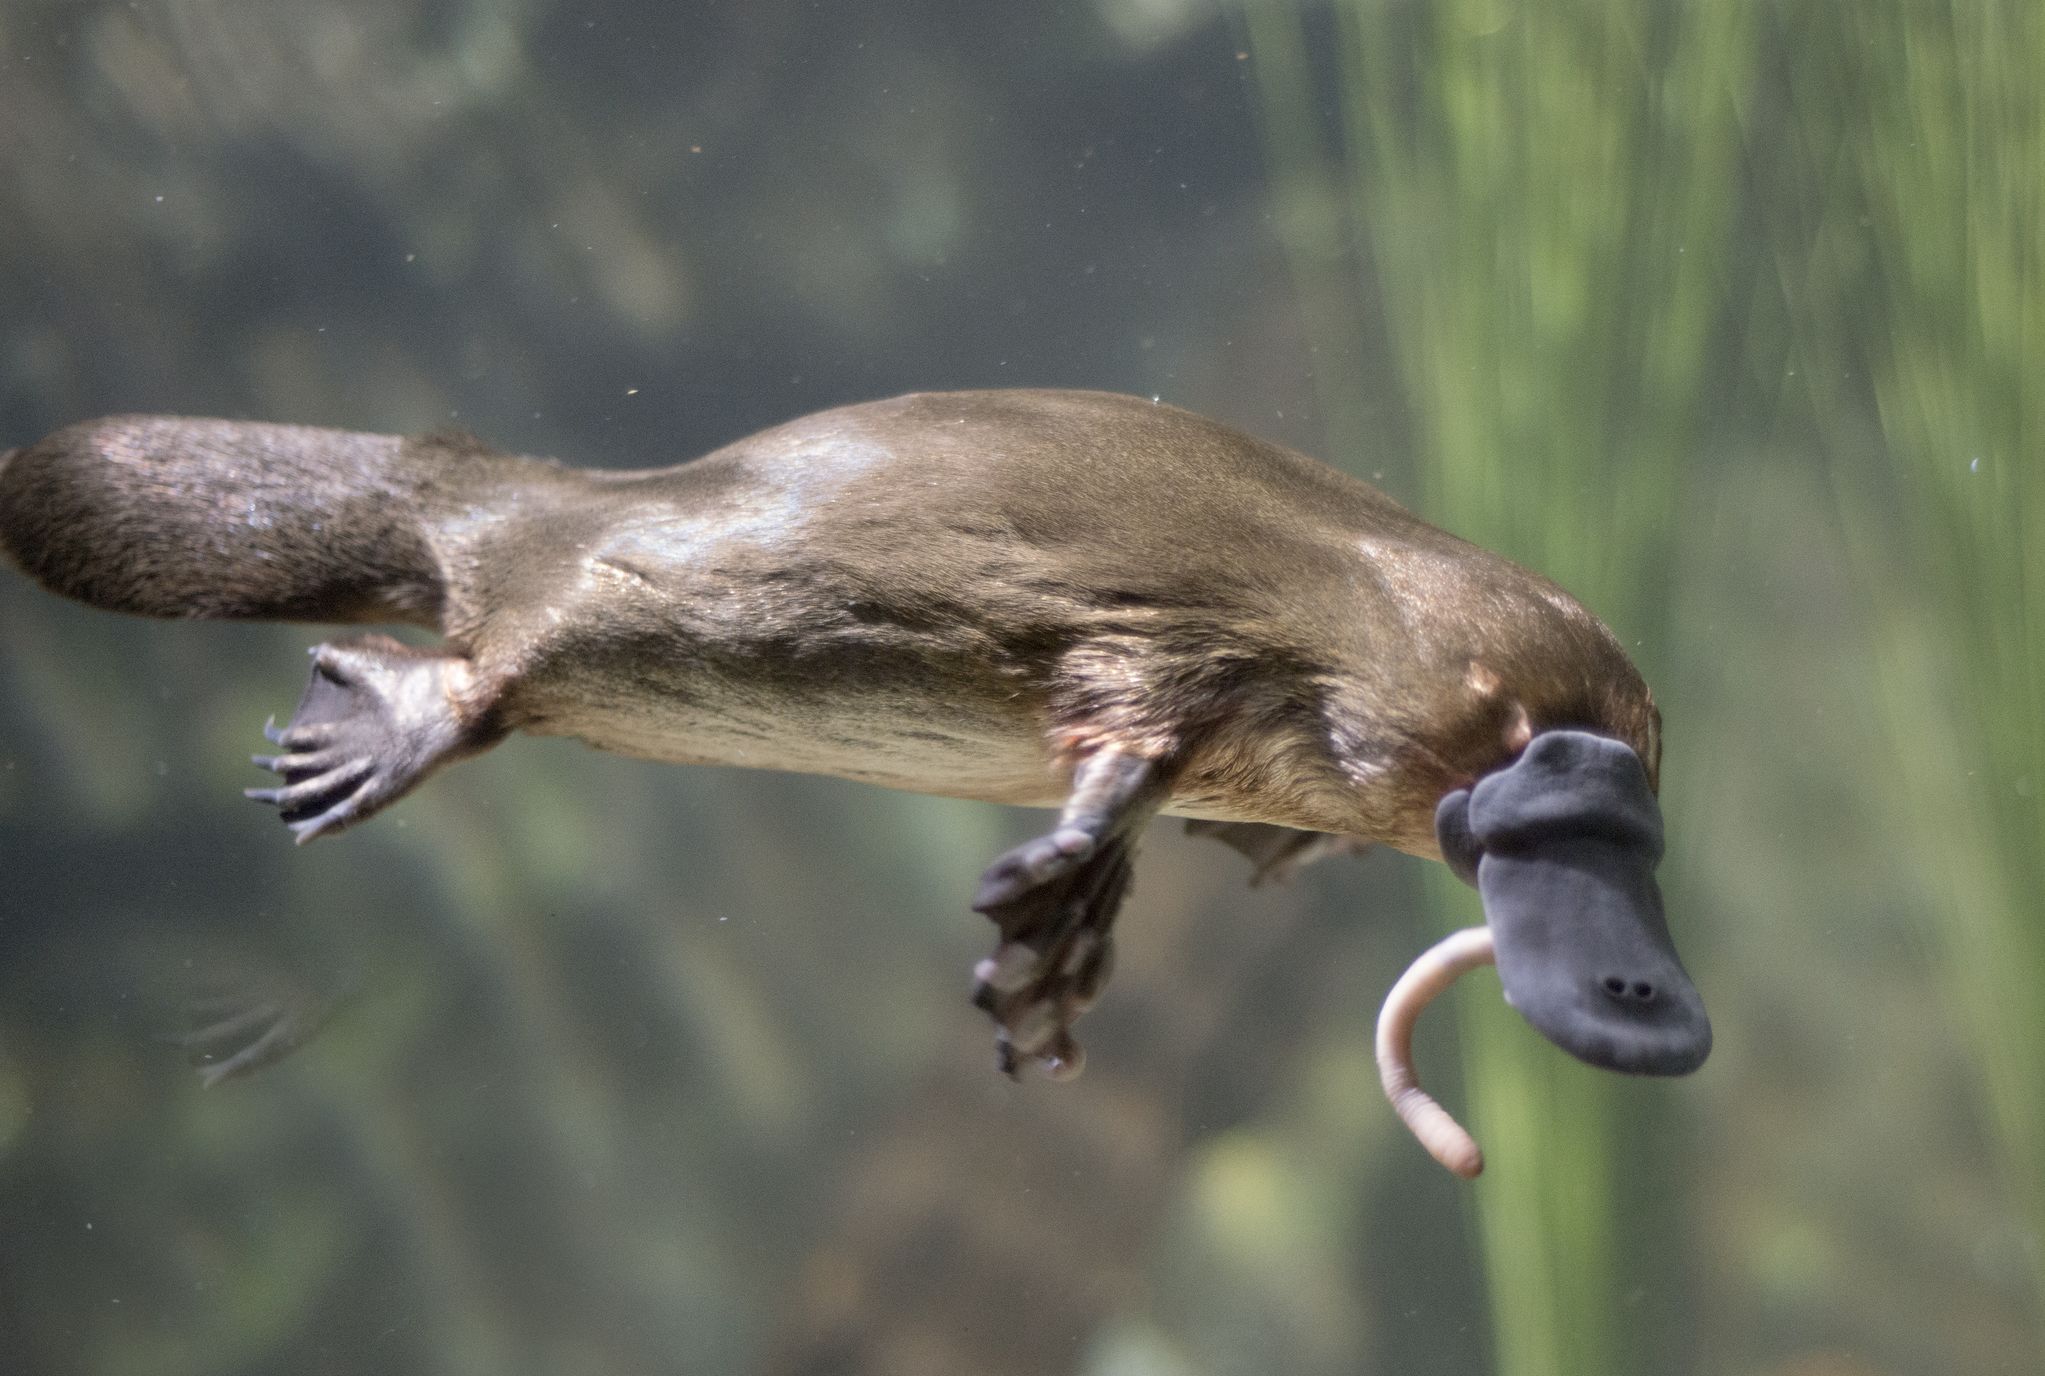
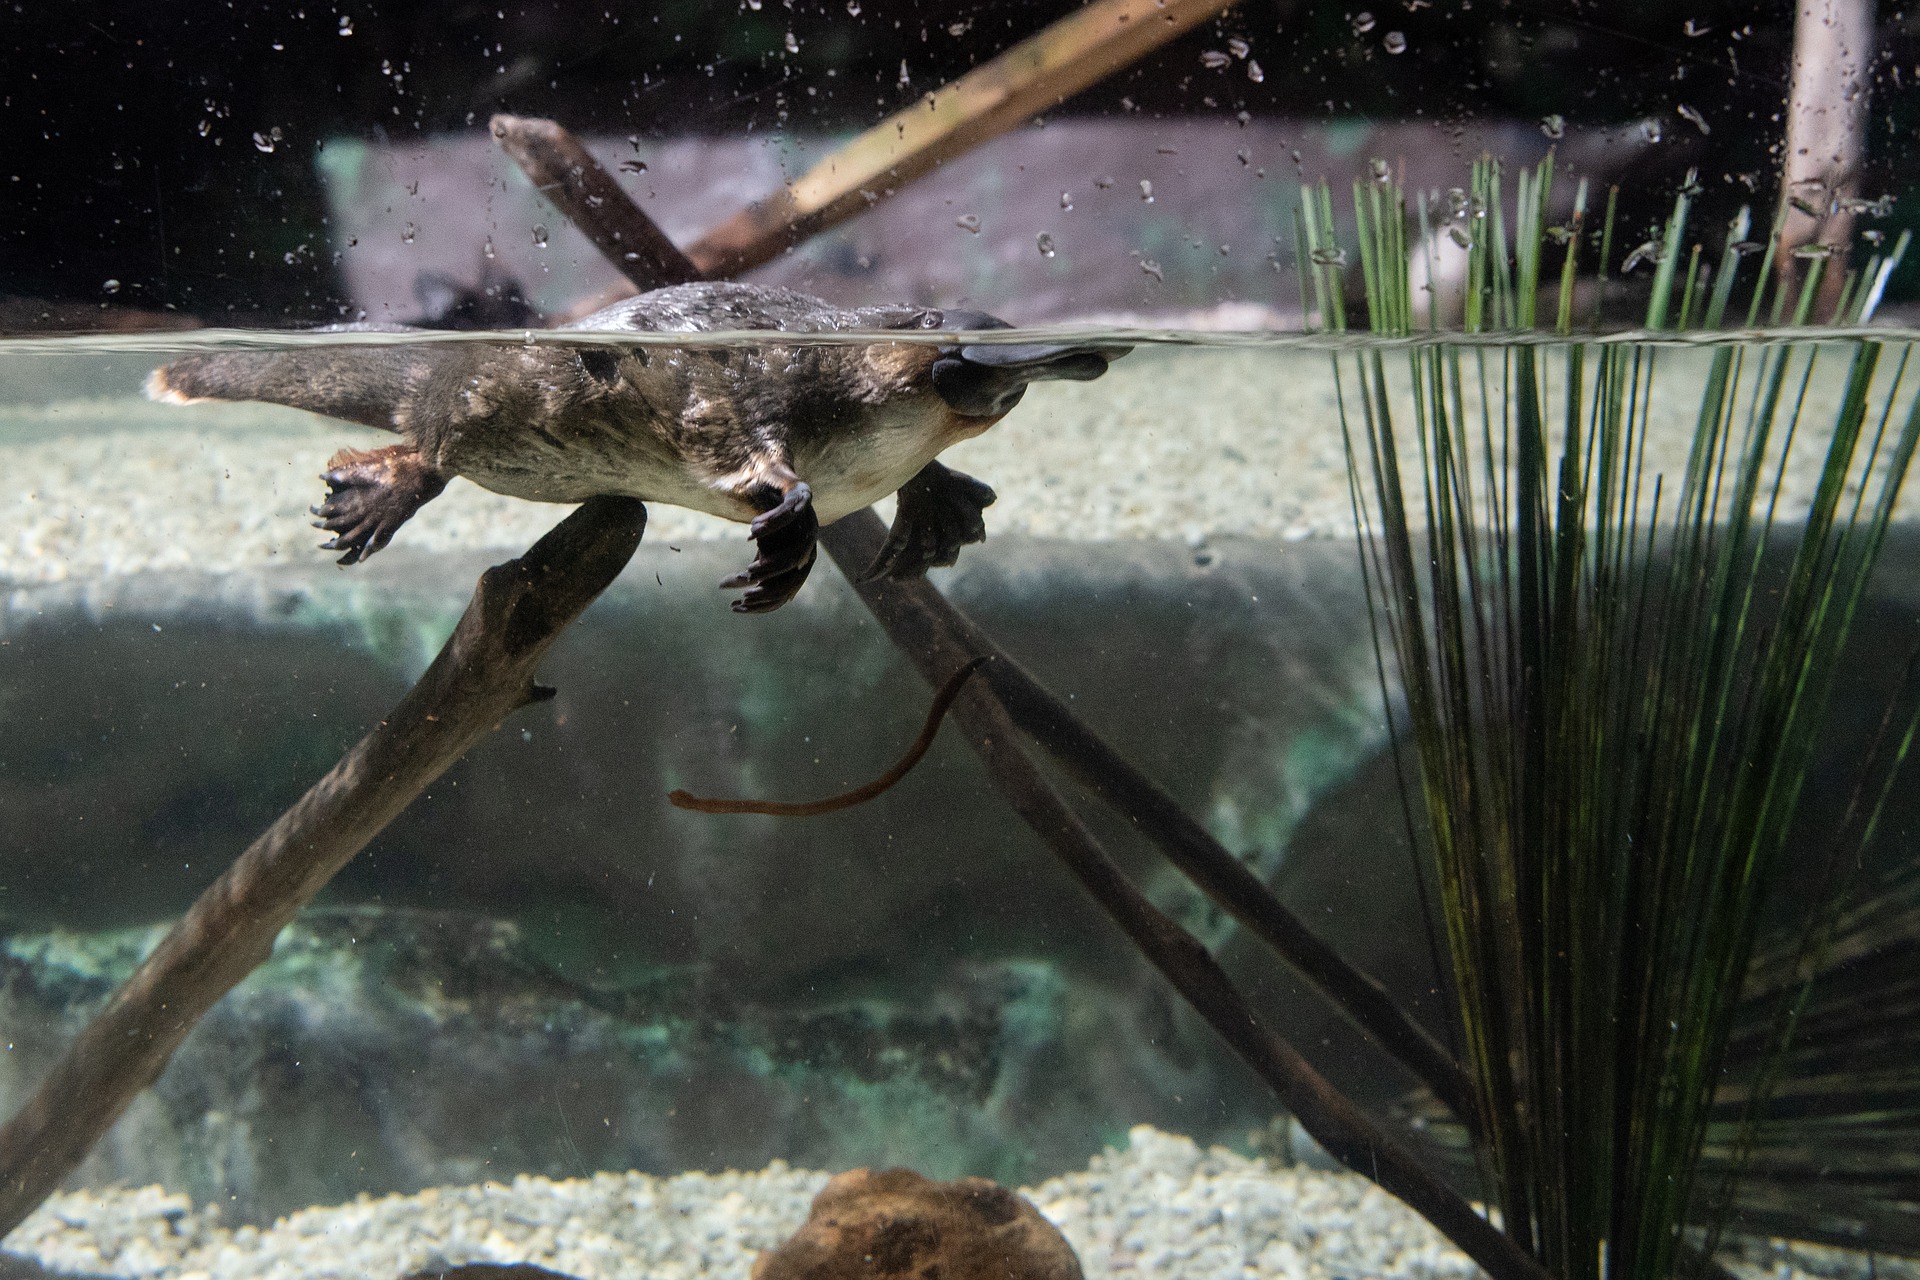
The aim of this project is to install smart water sensors into local areas known to be habitats for platypus. The will utilise environmental sensors connected to BBC Microbit which will allow the sensors to withdraw and store water quality information which is displayed nearby at signed stations. The signed stations will display the relevant information and act as a point where emergency information can be sent via 4G networks to relevant authorities. The equipment is to be designed utilising small-scale electronics powered by solar panels, as well as the BBC Microbit and E-waste which will allow for local students and community engagement. This allows the project to act as an educational tool that can raise awareness of Stormwater pollution. |
 |
|
The aim of this project is to install smart water sensors into local areas known to be habitats for platypus. The will utilise environmental sensors connected to BBC Microbit which will allow the sensors to withdraw and store water quality information which is displayed nearby at signed stations. The signed stations will display the relevant information and act as a point where emergency information can be sent via 4G networks to relevant authorities. The equipment is to be designed utilising small-scale electronics powered by solar panels, as well as the BBC Microbit and E-waste which will allow for local students and community engagement. This allows the project to act as an educational tool that can raise awareness of Stormwater pollution. |
|
 |
The Sensing Component measures the conductivity, pH and temperature values from the water on regular intervals. It then sends this data to another BBC Microbit via radio signals. The sensing component is placed in the water and powered by solar panels to make it gain clean energy. Once data is received by the BBC MicroBit that is attached to an Arduino, the Arduino then transmits the data onto the 4G network, to make it available for further analysis. This component is attached to a display board which is located near a sidewalk close to the Plenty River. This board uses 4 LEDs indicators to show the water quality at a particular time. This board also educates information about the platypuses which live in the river. This component also uses solar panels to get power. The Data Receiver and Storage Component consists of a BBC Microbit that receives the data from cloud using 4G network and then pass that data to Raspberry Pi via serial port using decoder settings ‘UTF-8’. The Raspberry Pi process the data and save it in the data storage location. Data is stored in 3 separate data storage locations for pH, Conductivity and Temperature. The Water Quality Checking System allows the user to extract data from the database and process it using Matplotlib library to plot various graphs (Line, Pie, Scattered graphs etc.). The application process data in yearly and daily wise and allows user to view daily and yearly wise graphs for each data value (Temperature, Conductivity and pH). |
|